Council budgets and spending Budget consultation responses
Respondents
1,064 individuals responded to the survey either directly online or by returning paper copies. Several optional demographic questions were asked toward the end of the survey, and on average around 70% of respondents answered these questions. You can view or download a PDF version of the report.
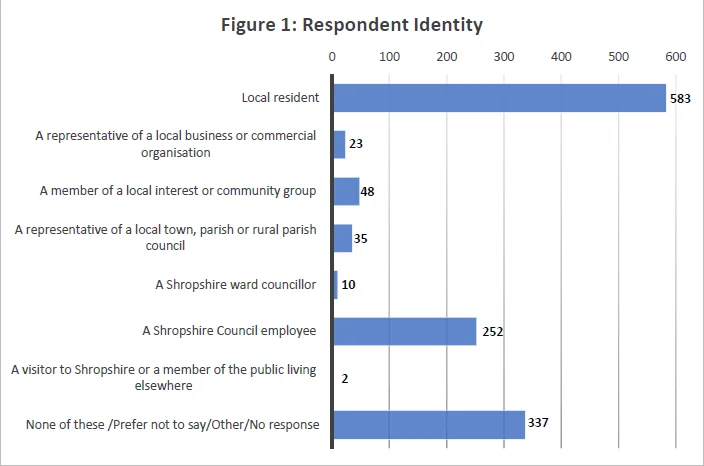
Self-Identification
Respondents were asked to identify themselves in the capacity they were answering the survey and were allowed to tick more than one box to identify themselves (see Figure 1 for a summary of the results). For example, most respondents (77%) identified as local residents. However, while a third of all respondents (252) identified themselves as Shropshire Council employees, 128 of these individuals also identified themselves as local residents.
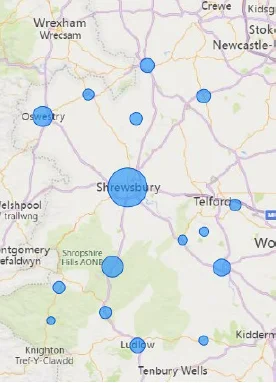
Location
Responses were returned by individuals living across the county, with Shrewsbury, Church Stretton, and Oswestry having the highest response rates across Shropshire towns (see Image 1f or map of approximate respondent locations).
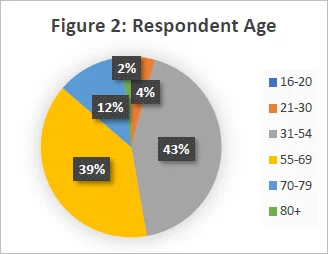
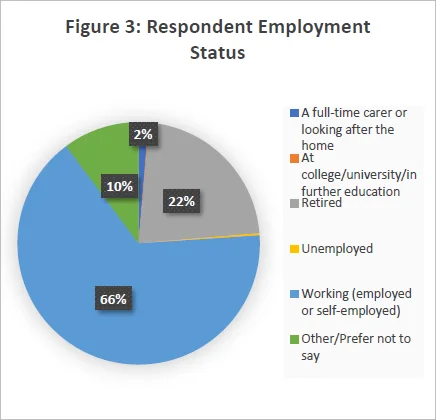
Age and employment status
Most respondents (75%) were aged between 31 and 69 years old and most (66%) said that they are working (see Figures 2 & 3)
Ethnicity
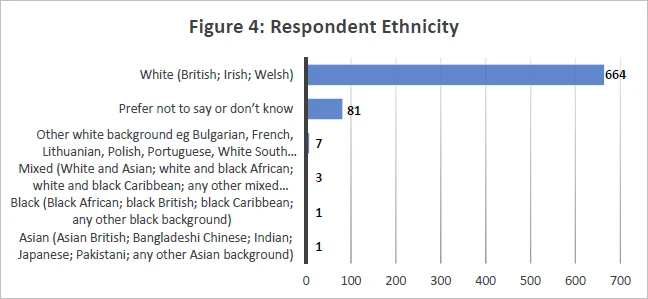
In terms of ethnicity, 88% of respondents identified as White (British; Irish; Welsh) with many saying they
“prefer not to say” in answer to this question (see Figure 4 for full ethnicity details). However, excluding those who prefer not to say, these results show that these survey respondents skew more White than the general population of Shropshire, where at least 3% identify as other than White (British; Irish; Welsh).
Council Tax and Capital Investment Plans
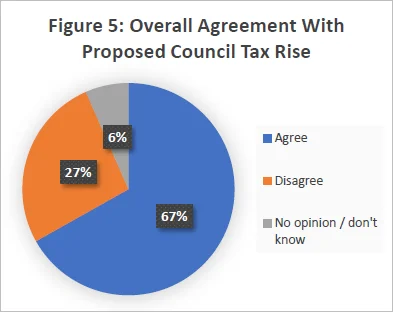
Overall, a majority (67%) of respondents agreed that a rise in council tax at the rate of 4.99% was warranted (see Figure 5). While respondents identifying as Shropshire Council employees agreed at a higher rate (75% agreed with the rise), a majority of non-employees (64%) also agreed that this rise was necessary.
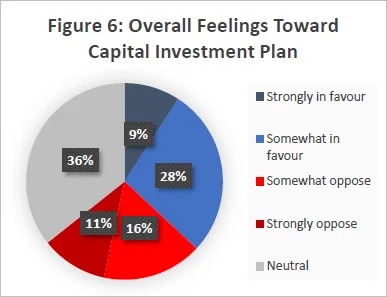
A majority of respondents (73%) are in favour of or neutral toward the council’s capital investment plans. Among council employees, the percentage is even higher, with 85% in favour of or neutral toward capital investment plans. However, even among non-employees, a majority (67%) still favour or feel neutral toward these plans.
Prioritisation and Service Area Protection
Overall, 70% of respondents agree with the council’s approach to prioritisation. This broad agreement was reflected across the board, as 82% of council employees agreed, and 64% of non-employee respondents were also in agreement.
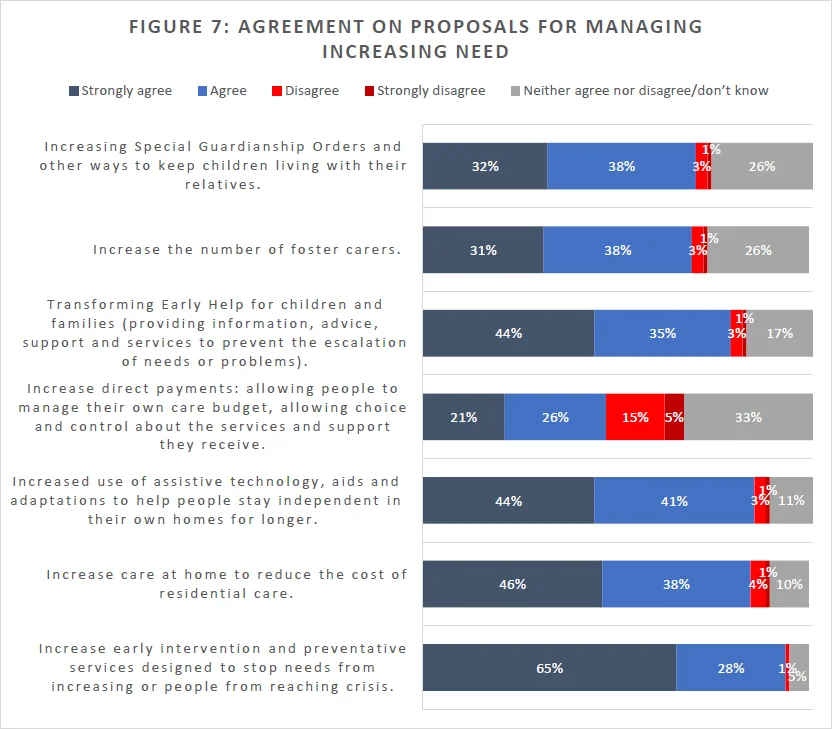
A majority of respondents “strongly agree” or “agree” with proposals for managing increasing need. The most disagreement is evident for the proposal to increase direct payments, where 20% of respondents either “disagreed” or “strongly disagreed” with this proposal.
When employee responses and those of non-employees were disaggregated, there was very little difference between the two in terms of agreement on these proposals.
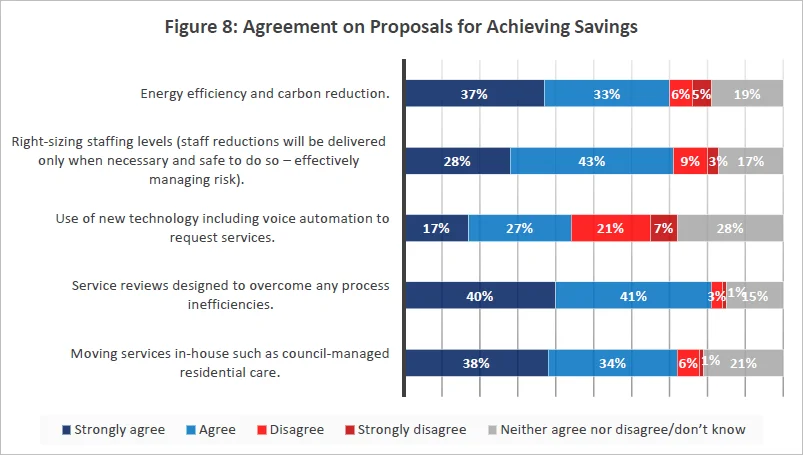
A majority of respondents “strongly agree” or “agree” with proposals for achieving savings, with the exception of the use of new technology to request services, where only a large minority agreed with this proposal, and 28% either “disagreed” or “strongly disagreed”.
As with managing increasing need, for this question on making savings, there was very little difference between Shropshire Council employees and non-employees in their responses to this question.
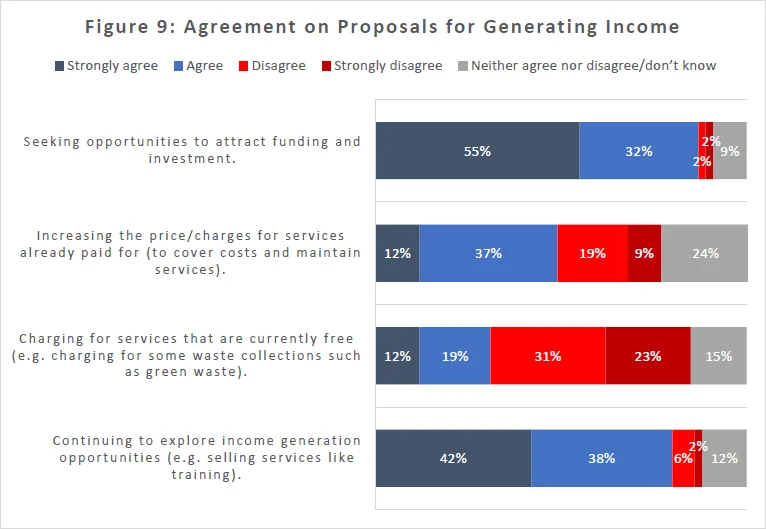
A majority of respondents “strongly agreed” or “agreed” with seeking opportunities to attract funding and investment, as well as exploring income generation opportunities. However, a majority “disagreed” or “strongly disagreed” with the proposal to charge for services that are currently free. A large minority (28%) also disagreed with increasing charges for things already paid for.
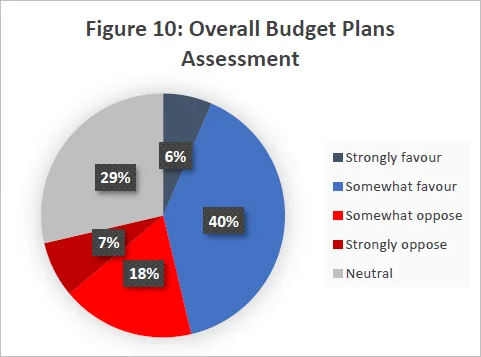
On the whole, a majority of respondents (75%) are either in favour of or neutral to the council’s budget
plans (see Figure 10).
